Visualizing Data
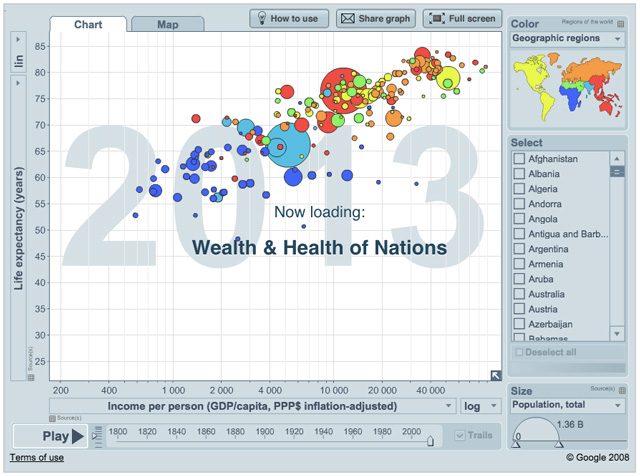
Hans Rosling’s 200 Countries, 200 Years, 4 Minutes – The Joy of Stats
Another excellent data viz video: Ted Talk- David McCandless: The beauty of data visualization
A. Insight from Edward Tufte

Tufte is the author of “The Visual Display of Quantitative Information” and “Envisioning Information.” He has been called “The Leonardo da Vinci of data,” by the New York Times and “The Galileo of graphics,” by Business Week.

1. Above all else, show the data
2. Induce the viewer to think about the substance rather than about methodology, graphic design, the tech of graphic production, or something else.
3. Avoid distorting the data, reflect balance, a proportion, a sense of relevant scale and eliminate “chart-junk.”

4. Present many numbers in a small space.
A map of the Napoleon’s Grande Armée’s advance and retreat into Russia

Charles Joseph Minard was a French civil engineer that created what Tufte calls, “The greatest statistical graphic ever drawn.” The graphic displays six different sets of data: latitude, longitude, direction of movement, time, temperature, and size of the army.
5. Make large datasets coherent.
6. Encourage the eye to compare different pieces of data.
7. Reveal data at several levels of detail, from a broad overview to the fine structure.
8. Serve a reasonably clear purpose: description, exploration, tabulation, or decoration.
9. Use words, numbers and drawings together.
“Lousy graphics omit context, bury critical information, cherry-pick data to advance a cause and heap on “chartjunk’’—a Tufteism (and there are many) for the smiley faces, irrelevant numbers and other doodads that distract us from grasping evidence, thinking about it and drawing smart conclusions.” — Intelligent Designs
B. Selecting the right visualization for your data set
What is your goal? Show change over time, identify patterns, make comparisons, investigate outliers, personalize with databases.
- How much has something changed?
- Who or where experienced the most change? Who changed the least?
- Which company or person got the most money?
- What is typical – and who stands out the most as being atypical?
- How often does a name appear? Where?
- How much was spent in total on something?
– Finding Stories with Spreadsheets, Paul Bradshaw
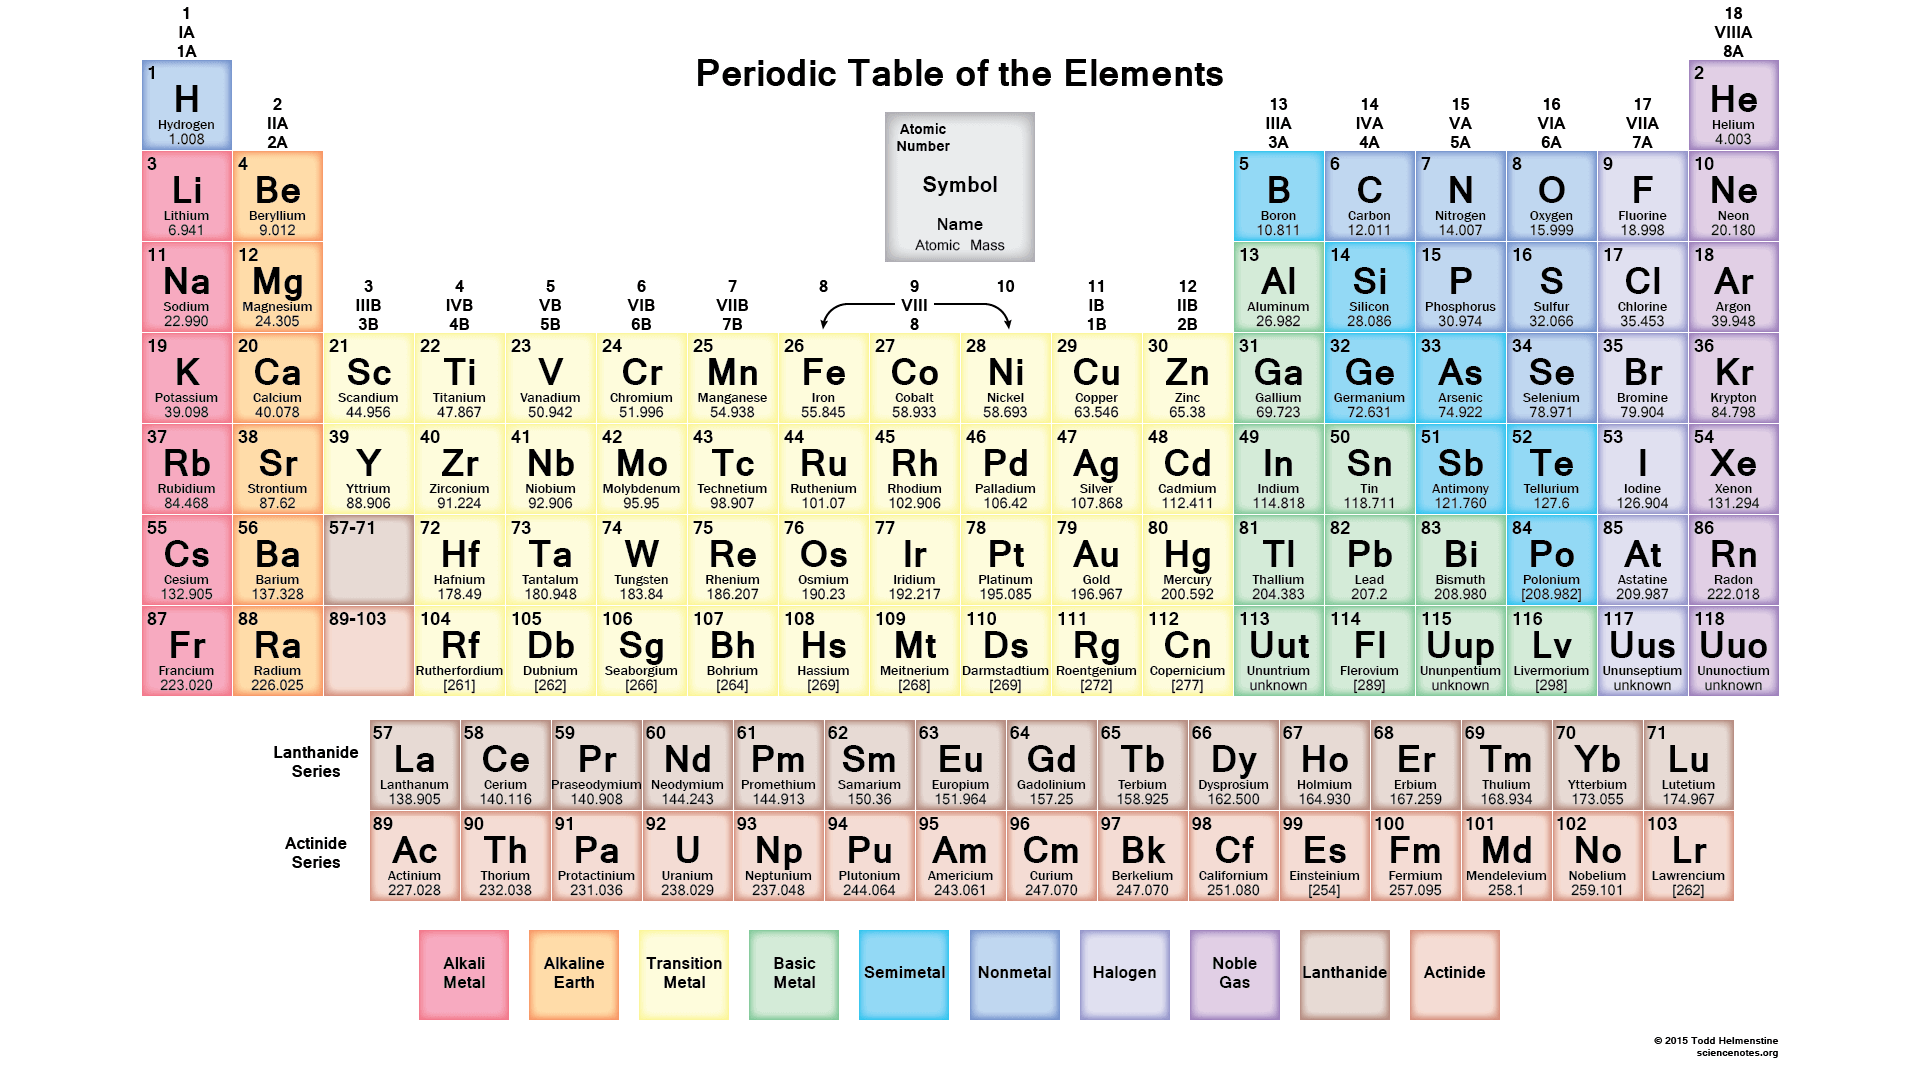
Tables
Periodic Table
Periodic Table of Storytelling

Charts
Graphics

C. What chart is best for your story?
Kurt Vonnegut on the Shapes of Stories
What is your goal: to compare? to show the parts of a whole? to show a range? to illustrate a relationship?

FT: Visual Vocabulary

NICAR: Choosing a Chart/Information Design
Bar chart: comparing data across categories
Bar charts are especially effective when you have numerical data that splits nicely into different categories so you can quickly see trends within your data.

The Race Gap in America’s Police Departments

Daily Routines of Famous Creative People


Column Chart

Which Countries Are Under the Most Strain in the European Migration Crisis?

“Germany has received more applicants than any other European Union nation, with more than 154,000 migrants seeking asylum from January to June, up from 68,000 in the same period last year. When adjusted for population, Hungary and Sweden are among the top recipients.”– NYTimes.com

The Language of the State of the Union

“An interactive chart reveals how the words presidents use reflect the twists and turns of American history.” – Atlantic Monthly

“The choice between buying a home and renting one is among the biggest financial decisions that many adults make. But the costs of buying are more varied and complicated than for renting, making it hard to tell which is a better deal. To help you answer this question, our calculator takes the most important costs associated with buying a house and computes the equivalent monthly rent.” — NYTimes.com
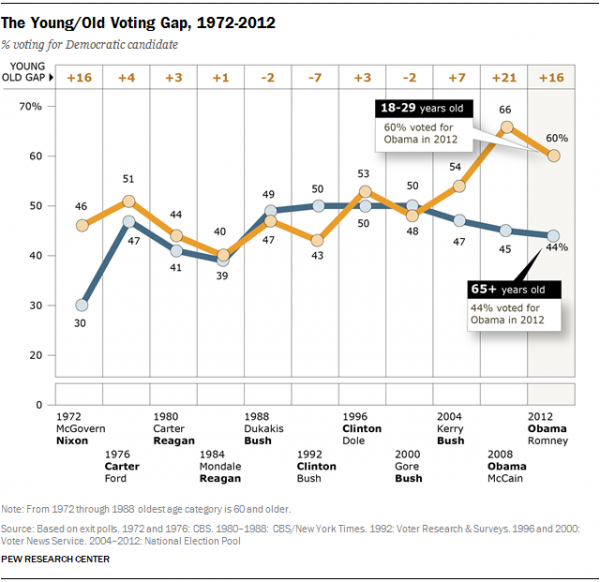
Line charts: change or trends over a period of time
Line charts connect individual numeric data points. The result is a simple, straightforward way to visualize a sequence of values. Their primary use is to displaytrends over a period of time.
Examples: stock price change over a five-year period, website page views during a month, revenue growth by quarter.
Bloomberg: How Americans Die

Gun deaths vs. terrorism deaths

Angela Merkel: 10 years in 10 charts

NYT: How Likely Is It That Birth Control Could Let You Down?
For every 100 women, the number who will have an unplanned pregnancy over a given number of years.


You Draw It: How Family Income Predicts Children’s College Chances

Pie charts: show relative proportions – or percentages
Pie charts should be used to show relative proportions – or percentages – of information. That’s it. Despite this narrow recommendation for when to use pies, they are made with abandon. As a result, they are the most commonly mis-used chart type.
If you are trying to compare data, leave it to bars or stacked bars. Don’t ask your viewer to translate pie wedges into relevant data or compare one pie to another. Key points from your data will be missed and the viewer has to work too hard.
Examples: percentage of budget spent on different departments, response categories from a survey, breakdown of how Americans spend their leisure time.
40 charts that explain the world

Area chart: line chart meets pie chart
How Non-employed Americans Spend Their Weekdays

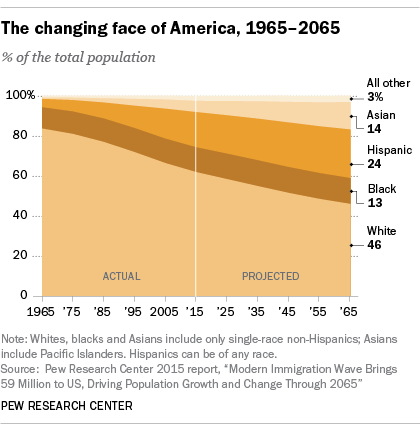
How Diverse is Your Generation?

Who Earned a Higher Salary Than You?

Scatter plot: investigate the relationship between different variables
WashPost: Where police forces don’t resemble the community
Bubble chart: show the concentration of data along two axes
Bubbles are not their own type of visualization but instead should be viewed as a technique to accentuate data on scatter plots or maps. People are drawn to using bubbles because the varied size of circles provides meaning about the data.

Student Debt at Colleges and Universities Across the Nation

“The average amount of debt that students have at graduation has increased at a vast majority of colleges and universities in the United States, according to data compiled by an advocacy group, the Institute for College Access and Success. The data on student debt is self-reported by the schools, and many institutions don’t participate. Other figures, like graduation rates, come from the Education Department.” — NYTimes
The Voting Habits of Americans Like You
The electorate is increasingly divided by race, education, gender and generation, and these fissures could grow even wider in the 2016 election. Below, new estimates of turnout and support for more than 8,000 different groups.


A Day in the Life of Americans

Histogram chart: understanding the range of your data
Histograms show distributions of variables whereas bar charts compare variables.
weigh 2 pounds or less, 3-5 pounds, 6-10 pounds, etc.

Treemap: Showing hierarchical data as a proportion of a whole


Heat map: compare data across categories using color
Where the Heat and the Thunder Hit Their Shots

Flow Charts: illustrating flow or process
512 Paths to the White House
Select a winner in the most competitive states below to see all the paths to victory available for either candidate.
 Data Visualizations
FiveThirtyEight: 47 Weirdest Visualizations

994 mass shootings in 1,004 days: this is what America’s gun crisis looks like


The Best in Show – the ultimate data dog
Dog data
“We examined dogs on intelligence, longevity, genetic ailments and other markers to create a “data-score” and then plotted it against public popularity of various breeds, according to the American Kennel Club.”


Propublica Workman’s Compensation
 “If you suffer a permanent injury on the job, you’re typically entitled to compensation for the damage to your body and your future lost wages. But depending on the state, benefits for the same body part can differ dramatically.”

Gay rights in the US, state by state

“Gay rights laws in America have evolved to allow — but in some cases ban — rights for gay, lesbian and transgender people on a range of issues, including marriage, hospital visitation, adoption, housing, employment and school bullying. The handling of gay rights issues vary by state and follow trends by region.” — Guardian
WaPo: Top Secret America


Fractions of a Second: An Olympic Musical
At the Olympics, the blink of an eye can be all that separates the gold medalist from the 10th-place finisher. In some events, this is obvious. But in others, with athletes racing one by one, the closeness of the race is harder to perceive.

D. Elements of a Chart

Resources:
Information is Beautiful
The Functional Art
The Daily Viz
chartsnthings
Infographics news
Flowing Data
Visualize This: The FlowingData Guide to Design, Visualization, and Statistics
The Wall Street Journal Guide to Information Graphics: The Dos and Don’ts of Presenting Data, Facts, and Figures
Google Spreadsheets
Basic math
Pivot table lesson